p5.plotterControl
p5-plotter-control examples
Example 1: timed events using setInterval()
Draws shapes at random positions. Uses the setInterval() function to plot a new shape every second.
| Link to code | Launch sketch in browser |
Example 2: timed events using millis() - “infinischotter”
Renders Georg Nees’ 1968 plotter-based drawing Schotter in real time. Uses a millis() based timer in the draw loop as a one-shot timed event that adds shapes to the drawing. Uses UI buttons (below the canvas) to start and stop the sequence.
  if(timerOn){
    if(millis()>prevMillis+interval){ //
      drawSchotterShape(); // draw the shape
      prevMillis = millis(); // reset the timer
    }
  }
| Link to code | Launch sketch in browser |
Example 3: live control using webcam via ml5.js handpose
Uses the ml5.js implementation of HandPose to detect the position of a person’s hand on a webcam. By tracking the distance between the tips of the index finger and thumb, a pinch gesture is detected. When the pinch is detected, the pen is lowered and traces the position of the pinched fingers. When the pinch is released, the pen is raised.
| Link to code | Launch sketch in browser |
Example 4: audio-reactive drawing
Draws a graph of the amplitude of audio input in your computer’s built in microphone.
| Link to code | Launch sketch in browser |
Example 5: speech recognition
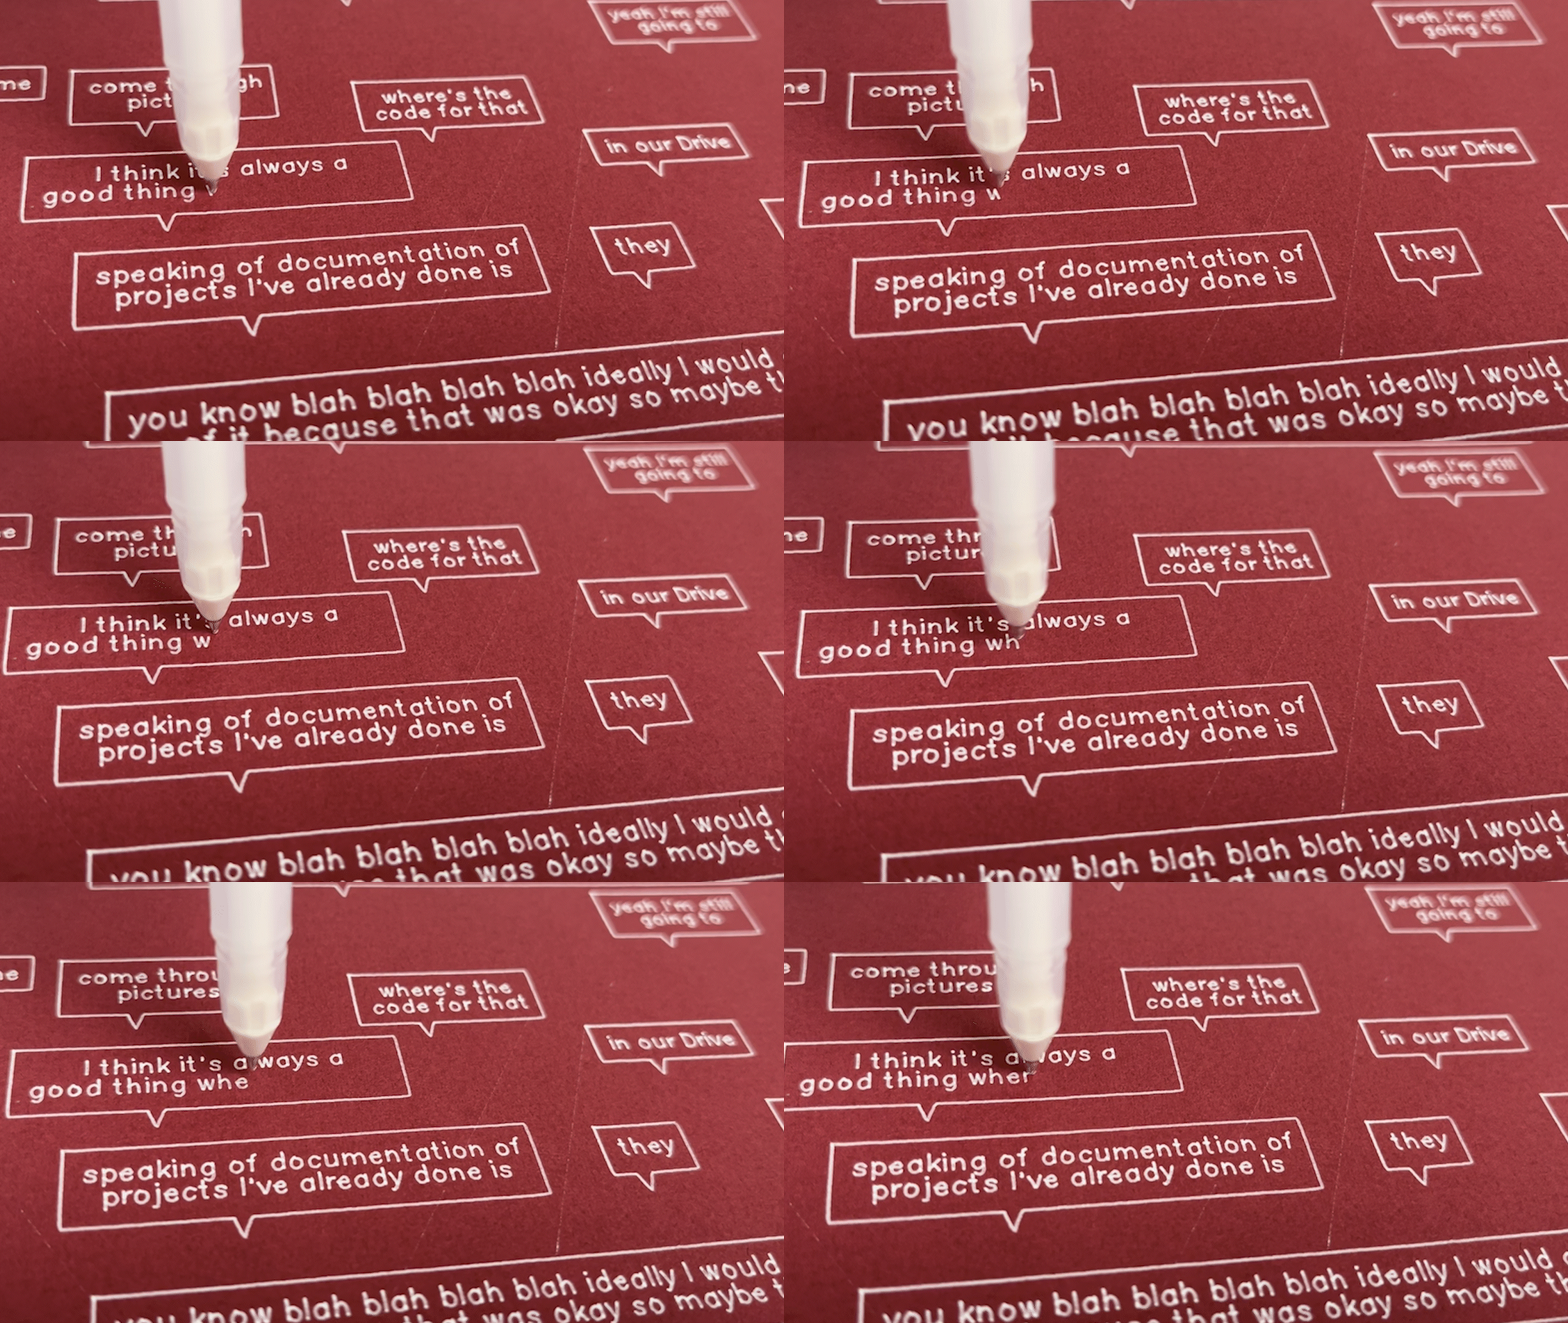
Using p5.speech, detects fragments of speech via the microphone, and plots them as text inside speech bubbles.
| Link to code | Launch sketch in browser |